Your analytics dashboard
Pick the metrics you care about, choose any period, compare it with the previous period or year, and arrange the cards your way.
Analytics puts every number Crovio measures in one dashboard: revenue Crovio added, your store's revenue and orders, A/B tests, bundles, checkout blocks, post-purchase, discounts, pre-orders and subscriptions.
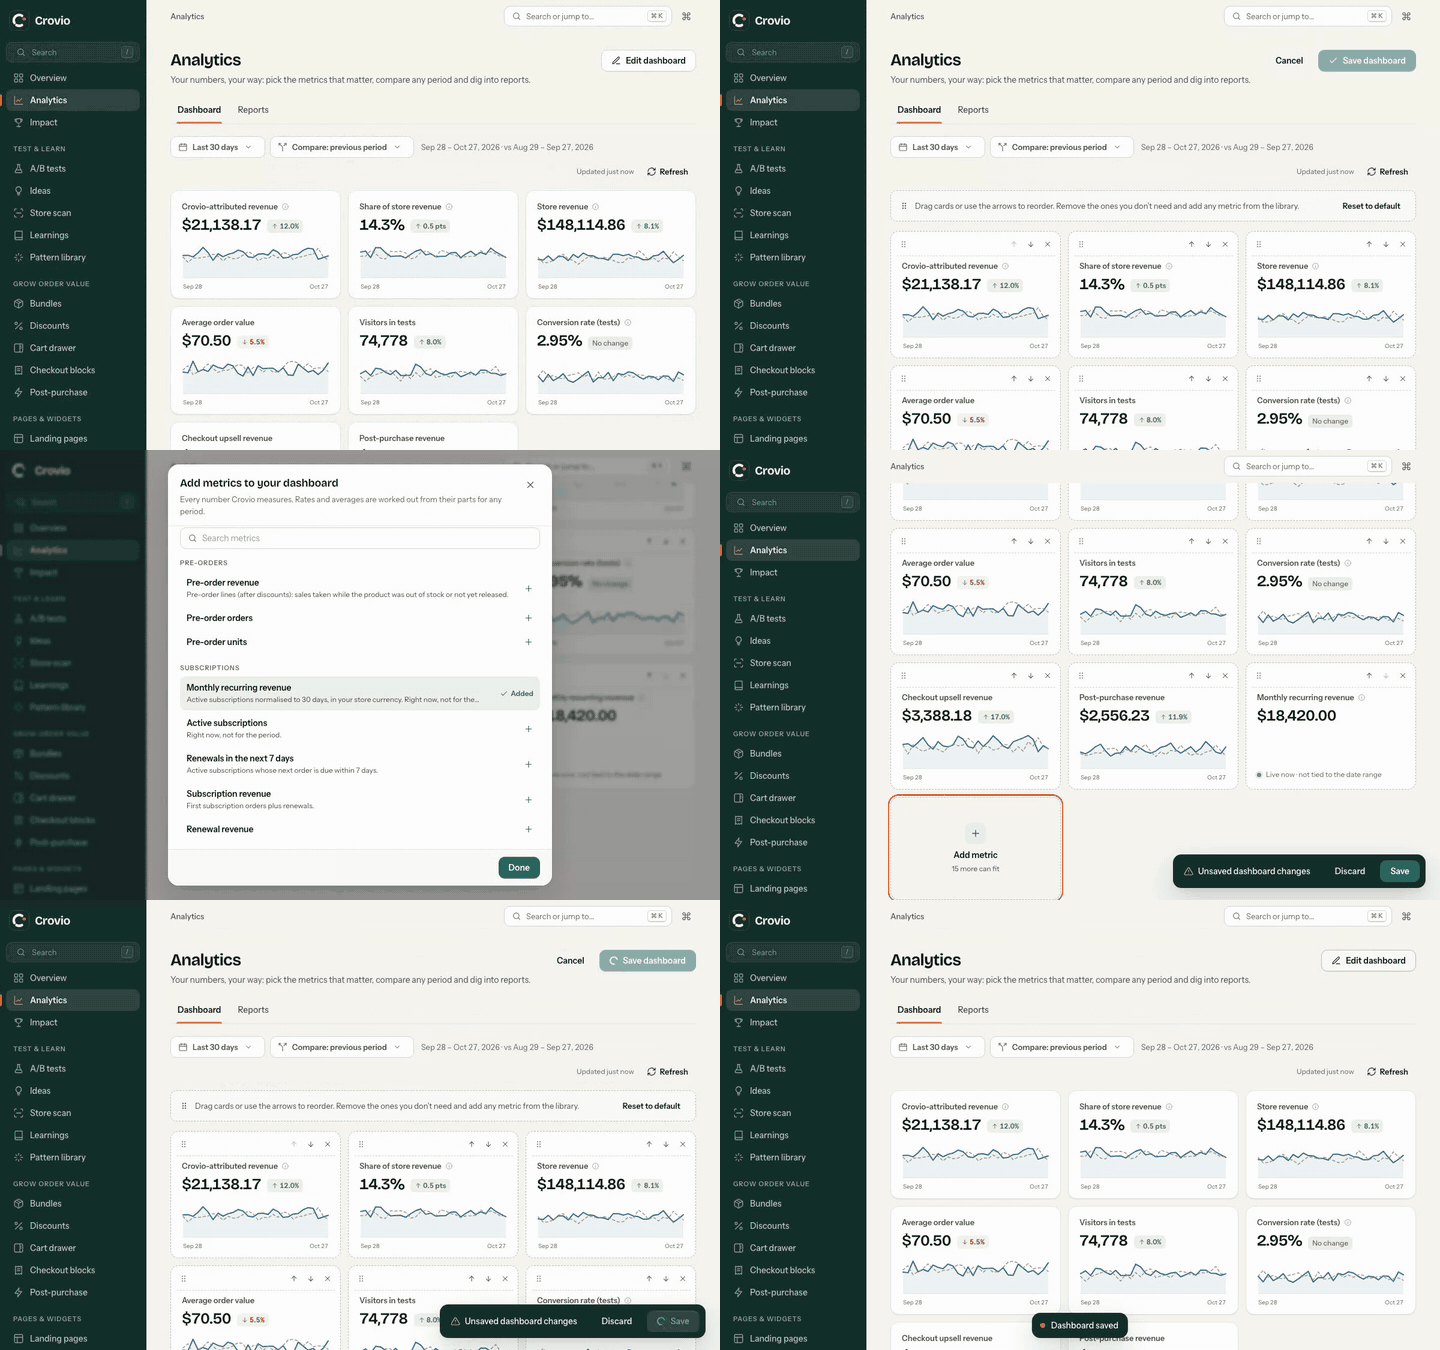
Pick a period
- Date range: today, yesterday, the last 7, 30 or 90 days or 12 months, month, quarter or year to date, last month, last year, all time, or your own Start and end dates.
- Compare to: Previous period, Previous year or No comparison. Each card shows the change. Weekly comparisons line up day for day, and month comparisons follow the calendar.
Cards marked Live now (MRR, active subscriptions, renewals in the next 7 days) show the current value, not the period.
Customize the dashboard
- Click Edit dashboard.
- Click Add metric and pick from the library. It's grouped by tool (Crovio, Store, A/B tests, Bundles, Checkout blocks, Post-purchase, Discounts, Pre-orders, Subscriptions) and explains each metric. Rates and averages are worked out from their parts for any period.
- Drag cards (or use the arrows) to reorder; remove the ones you don't need.
- Click Save dashboard. Reset to default brings back the original set.
Numbers update through the day; Refresh fetches the latest.
Metrics worth knowing
| Metric | What it counts |
|---|---|
| Crovio-attributed revenue | Revenue from what Crovio added or sold: bundles, checkout and post-purchase upsells, pre-orders and subscriptions. Each order line counts once |
| Share of store revenue | Crovio-attributed revenue as a share of all store revenue |
| Crovio discount cost | What Crovio's offers gave away |
| Est. extra revenue from winners | What winning tests add when rolled out |
| Monthly recurring revenue | Active subscriptions normalised to 30 days, right now |
For a breakdown (by test, bundle, product, source, country, device, plan or reason) or a CSV, build a report. For a client-ready summary, see Impact.
Was this page helpful?